Mermaid diagrams
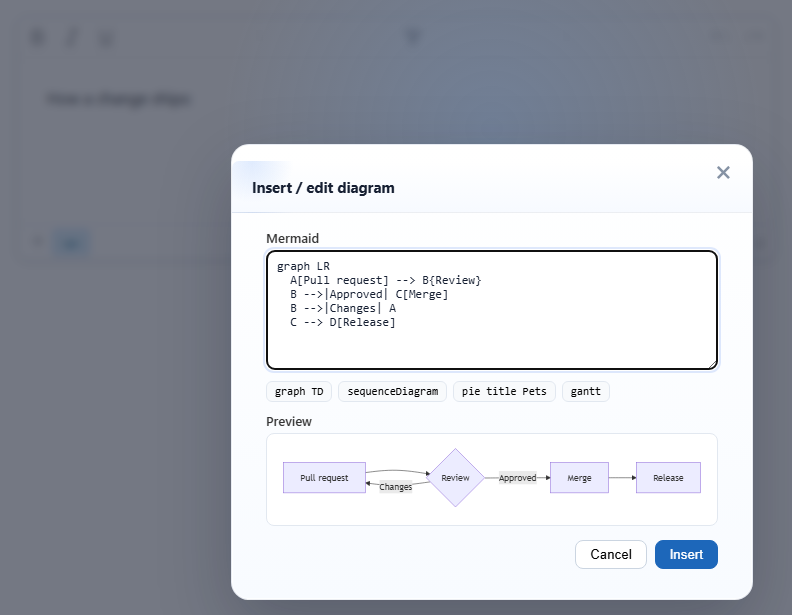
Write flowcharts, sequence diagrams, pie charts and Gantt charts as Mermaid text, and the editor draws them as a block in the document. Mermaid itself is not part of the editor: your page loads it, or your server renders the diagram.
Turn it on
The feature is the mermaiddiagram.js plugin (also in plugins/all_plugins.js). The toolbar item is insertdiagram (tooltip "Diagram"). The default toolbar has it in the "More" (⋮) menu; in your own toolbar add insertdiagram. To draw diagrams in the browser, load Mermaid before you create the editor:
<link rel="stylesheet" href="/richtexteditor/rte_theme_default.css" />
<script src="https://cdn.jsdelivr.net/npm/mermaid@11.4.1/dist/mermaid.min.js"></script>
<script src="/richtexteditor/rte.js"></script>
<script src="/richtexteditor/plugins/mermaiddiagram.js"></script>

<div id="div_editor1"><p>How a change ships:</p></div>
<script>
mermaid.initialize({ startOnLoad: false });
var editor1 = new RichTextEditor("#div_editor1", {
  toolbar: "custom",
  toolbar_custom: "{bold,italic,underline}|{insertdiagram}|{undo,redo}"
});
</script>
Where the drawing comes from
The plugin loads nothing from the network. For each diagram it uses the first of these that is available:
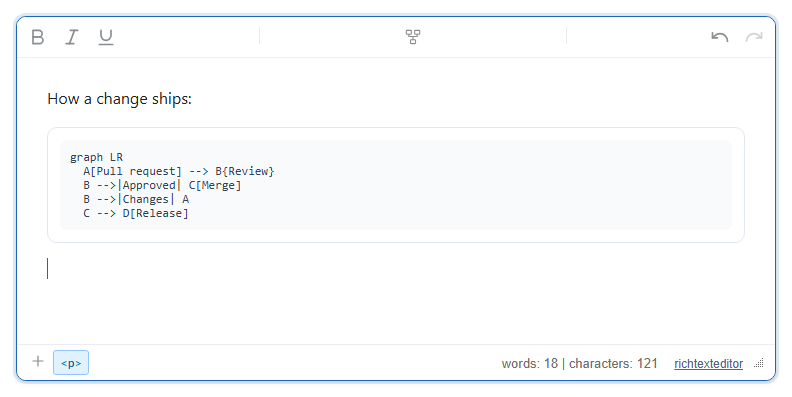
diagramResolver, your function. It gets the Mermaid source and returns a Promise of{ svg: "<svg…" }or{ imageUrl: "…" }. Use it to render on your server (for example with Kroki or mermaid-cli).window.mermaidon the page (or its parent window). The plugin handles both the oldermermaid.renderthat returns a string (versions 8 and 9) and the one that returns a Promise (10 and later); these pages were tested with 11.4.1.- Neither: the block shows the source as code, and the dialog says "No Mermaid renderer detected on the page". The source is kept, so the diagram can be drawn later.
Options
| Option | Default | What it does |
|---|---|---|
diagramResolver | null | Your renderer, used before window.mermaid. If it rejects, the source is shown with the error message. |
diagramSamples | Four samples: a flowchart (graph TD), a sequenceDiagram, a pie and a gantt | The sample buttons in the dialog. Each button shows the first line of its sample. |
text_insertdiagram, text_insertdiagramtitle, text_insertdiagramlabel, text_insertdiagrampreview | "Diagram", "Insert / edit diagram", "Mermaid", "Preview" | Button tooltip, dialog title and labels. |
A server-side resolver looks like this (the URL is yours):
diagramResolver: function (source) {
  return fetch("/api/diagram", { method: "POST", body: source })
    .then(function (r) { return r.text(); })
    .then(function (svg) { return { svg: svg }; });
}
Using it
- Click the button, call
editor1.execCommand("insertdiagram"), or pick "Diagram" in the slash menu. Type or pick a sample, then Insert. - Editing. Double-click a diagram to reopen the dialog with its source; the button then reads Update.
- Removing. Hover the block and click the round × in its corner, or press Delete or Backspace with the caret in the block.
- Errors. If Mermaid cannot parse the source, the preview shows the source and Mermaid's message in red ("Parse error on line 3 …").
editor1.renderDiagrams()draws every diagram block again and returns how many it found. Call it aftersetHTMLCodewith content that has no drawing yet.
Things to know
- The saved block keeps the source in
data-diagramand the drawing inside it (shortened here):
With Mermaid the drawing is inline SVG (about 4 KB for the flowchart above); without it, a<div class="rte-mermaid" data-rte-diagram="1" data-diagram="graph LR A[Pull request] --> B{Review} …" contenteditable="false" style=""><button type="button" class="rte-mermaid-remove" data-rte-mermaid-remove="1" aria-label="Remove diagram" title="Remove diagram">x</button><div class="rte-mermaid-render"><svg …>…</svg></div></div><pre class="rte-mermaid-src">. - The × remove button is saved with the content. Hide it where you display the HTML, or it shows as an "x" on your page.
- After a diagram is edited with Update, its
data-diagramis HTML-encoded twice (-->is stored as--&gt;). The editor reads both forms, but your own code has to decode the value once more. - The block's frame style exists only inside the editor. To show saved diagrams, hide the button and draw from the source; this worked for both new and edited blocks:
<style>.rte-mermaid-remove { display: none; }</style> <script src="https://cdn.jsdelivr.net/npm/mermaid@11.4.1/dist/mermaid.min.js"></script> <script> mermaid.initialize({ startOnLoad: false }); function decode(s) { return s.replace(/"/g, '"').replace(/>/g, ">").replace(/</g, "<").replace(/&/g, "&"); } document.querySelectorAll(".rte-mermaid[data-diagram]").forEach(function (block, i) { var target = block.querySelector(".rte-mermaid-render") || block; mermaid.render("saved-diagram-" + i, decode(block.getAttribute("data-diagram"))) .then(function (result) { target.innerHTML = result.svg; }); }); </script> - Sanitizers must keep the
divattributes above and either allow inline SVG or strip it and draw again fromdata-diagramas shown. mermaid.min.js11.4.1 is about 2.6 MB. Load it only on pages that edit or show diagrams, and host it yourself if the page must work offline.
Related: diagrams demo, toolbar items reference.